

Are you looking for a new supplier, analyzing competitors, or identifying potential markets? International trade data is your key. In this field, Trade Map (from the ITC) and TradeSparq are two of the most prominent names.
So, which tool is the best? Let’s dive into a detailed comparison of these two platforms to make the right decision for your business strategy.
I. Trade Map: Official Global Statistical Data
Trade Map is a market analysis tool developed by the International Trade Centre (ITC), a joint agency of the World Trade Organization (WTO) and the United Nations (UN).
Core Strengths of Trade Map (Statistical Data)
- Global & Official Scope:
- The main data source is UN Comtrade, aggregating reports from over 220 countries and territories.
- The data is official and internationally recognized.
- In-depth Macro Analysis:
- Provides data categorized by HS Code at the
or
-digit level.
- Helps answer crucial macro-level questions like: What is the global market size for a specific product? What is a country’s market share? What is the growth rate of the target market?
- Provides data categorized by HS Code at the
- Tariff Integration:
- Integrates tariff and Non-Tariff Measures (NTMs) data through its linked tool, the Market Access Map (MacMap).
- Mirror Statistics:
- Capable of calculating mirror statistics for countries that do not report data, which provides a more complete picture of global trade (this data is usually flagged for distinction).
Limitations of Trade Map
- Limited Detail: Data is restricted to the macro level, based on HS codes. You cannot find the specific name of the exporting/importing company, contact person, or details of the Bill of Lading.
- Update Frequency: Typically updated annually or quarterly (mainly for OECD countries). The data is not real-time.
II. TradeSparq: Detailed Bill of Lading Data
TradeSparq is a private trade data platform, renowned for providing customs data (also known as Bill of Lading data) from countries that require this information to be publicly disclosed.
Core Strengths of TradeSparq (Bill of Lading Data)
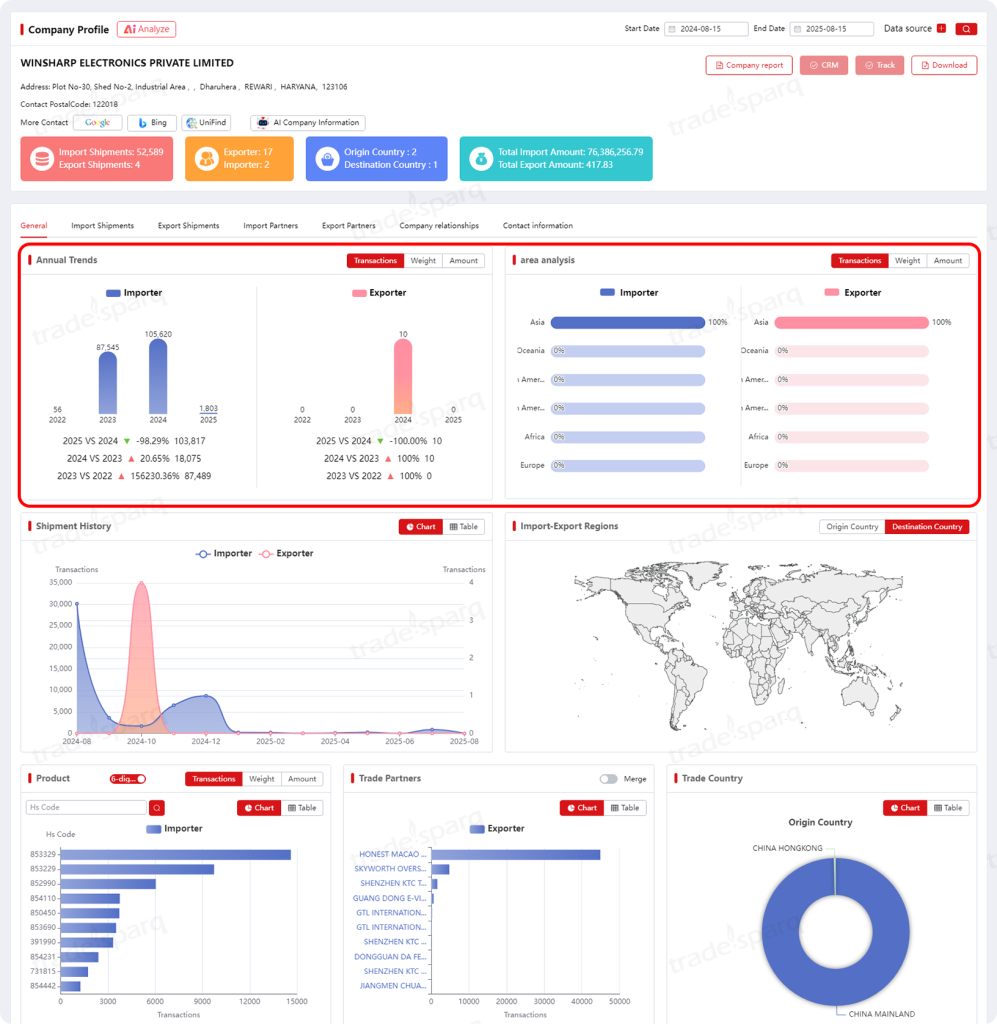
- Transaction-by-Transaction Detail (Micro-level):
- This is its biggest advantage. The data provides information on the names of the exporting and importing companies, port of loading/discharge, specific goods description, quantity, and Bill of Lading details.
- Helps you identify specific partners/suppliers/competitors.
- Rapid Updates:
- Data is updated from customs declarations, allowing you to track trade activity in near real-time (daily or weekly, depending on the country).
- Business Development Tool:
- Designed to generate leads, monitor competitors’ activities, and scout for new suppliers based on actual transaction data.
- Reasonable Cost: As a specialized private service, the cost of using Bill of Lading platforms is fairly reasonable in comparison with Panjiva, Globalwits,…
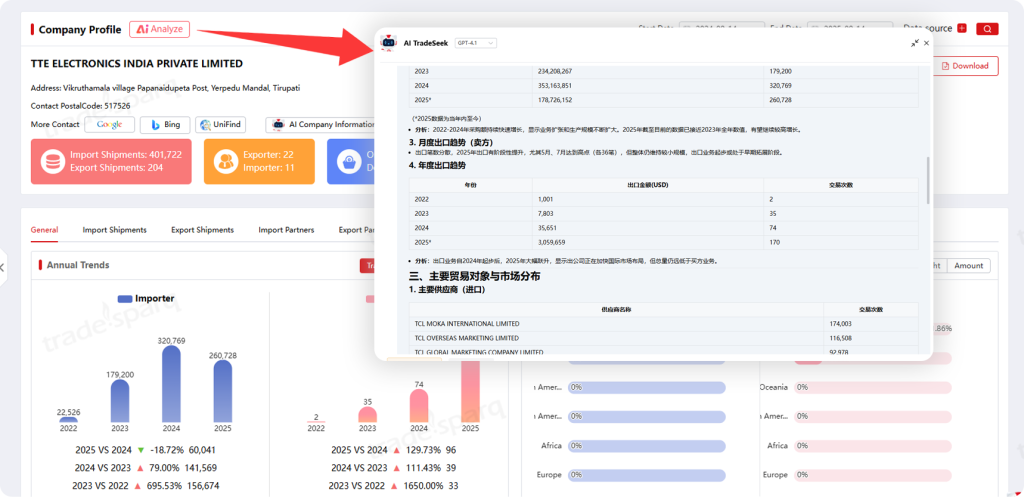
- AI functions with analytic reports:
The release centers on “AI Empowerment, Market Insights, Smart Marketing, and Experience Reimagined“, building an even smarter, end-to-end foreign-trade service system that injects fresh momentum into your global expansion.- AI-Expanded Keywords for Product/HS-Code Search on Tradesparq data
- AI Analytics: Deeply interprets company profiles and trade data, distilling core trends (import/export volumes, annual/monthly trade patterns, key trading partners, partnership dynamics, etc.) to deliver an overall assessment and strategic positioning advice.
- AI Toolkit: Generate professional foreign-trade emails or social-media copy in seconds. Whether you need high-impact outreach messages or platform-tailored posts that resonate with each platform’s audience, the AI toolkit is your go-to assistant for global business development.
Limitations of TradeSparq
- Limited Country Coverage: Bill of Lading data is available for over 60 countries that publicly release this information (e.g., the US, India, Mexico, Vietnam, etc.). You cannot get detailed Bill of Lading data for all
countries.
- Micro Data: Requires more filtering and analysis compared to Trade Map to draw macro-level conclusions.
III. Visual Comparison: Trade Map vs TradeSparq
| Criterion | Trade Map (ITC) | TradeSparq |
| Data Source | UN Comtrade & National Customs Reports | Public Bill of Lading Data and other sources |
| Data Type | Macro-level Statistics | Micro-level Transactions |
| Detail Level | By HS Code ( | Exporter/Importer Company Names, detailed goods description, ports, prices,… |
| Update Frequency | Annually/Quarterly | Near Real-Time (Daily/Weekly) |
| Coverage | Over | Limited to 60-80 countries |
| Primary Goal | Market Analysis, Market Share, Trend Identification | Lead Generation, Supplier/Customer Sourcing, Competitor Monitoring |
| Cost | Reasonable | Reasonable |
IV. Conclusion: Which Tool Is Best?
There is no single “best” tool; only the one most suitable for your objectives:
- Trade Map is the best choice for:
- Macro Market Research: You need to know if Vietnam’s total coffee exports to the world are increasing or decreasing.
- Policy Analysis: You need to understand the tariffs applied to a product in any given market.
- Academic/Research Purposes: You need official, global, and reliable data.
- TradeSparq is the best choice for:
- Sourcing Business Partners: You want to know exactly which US companies imported Vietnamese product X in the last
months.
- Competitor Monitoring: You want to see where your competitor is shipping goods and in what quantity.
- Supply Chain Analysis: You need to find a specific component supplier in many countries.
- Sourcing Business Partners: You want to know exactly which US companies imported Vietnamese product X in the last
Recommendation: A comprehensive trade strategy should combine both. Use Trade Map to define the big picture (Macro), then use TradeSparq to “zoom in” on actual transaction details and partner identification (Micro).
 Ask more via WhatsApp
If you need further information about trade data providers, let us know by your comments below.
More articles: